Simulation Interface
Last updated
Last updated
Now that we have created scenarios and explored the different ways to simulate, let us see few features that can help you with customizing and fine tuning your scenario analysis.
Any important node that drives the KPIs can be added as a Key Input so that it can be viewed and simulated quickly instead of searching for it in the model. You can add multiple key inputs, so that they can be simulated at once and the overall impact can be understood.
Click the menu icon on the top right corner of the node and choose Add to Key Inputs to add that node as a key driver.
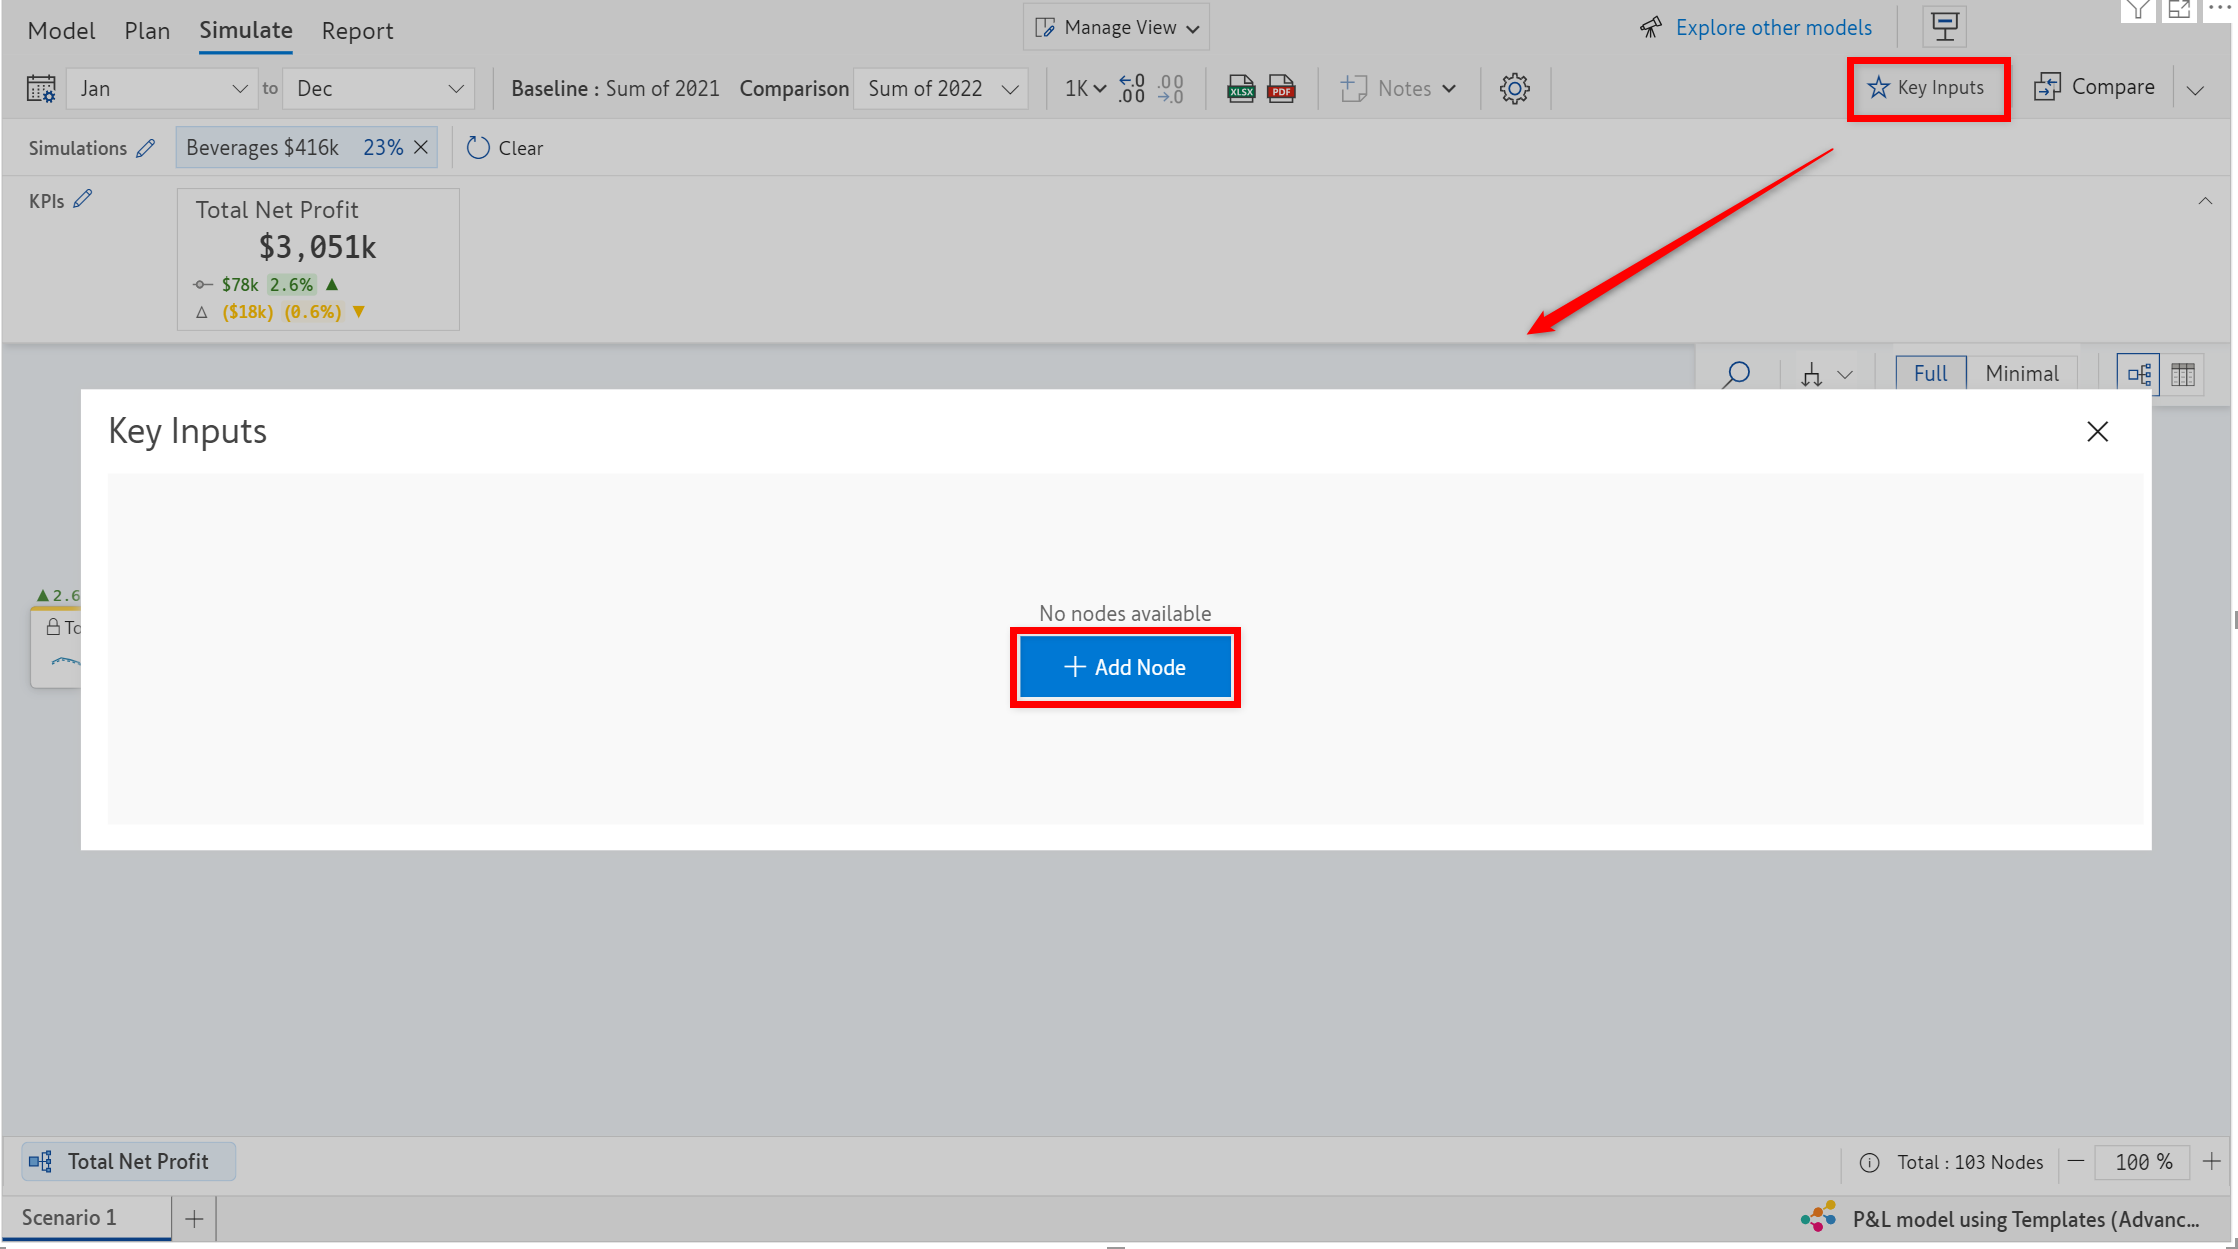
You can also add key inputs by clicking on +Add in the Key Inputs section.
A pop-up opens in which you can select the desired nodes to be added as key inputs.
Key inputs added would be displayed in the Key Inputs section where you can instantly edit their values to simulate them and view the results.
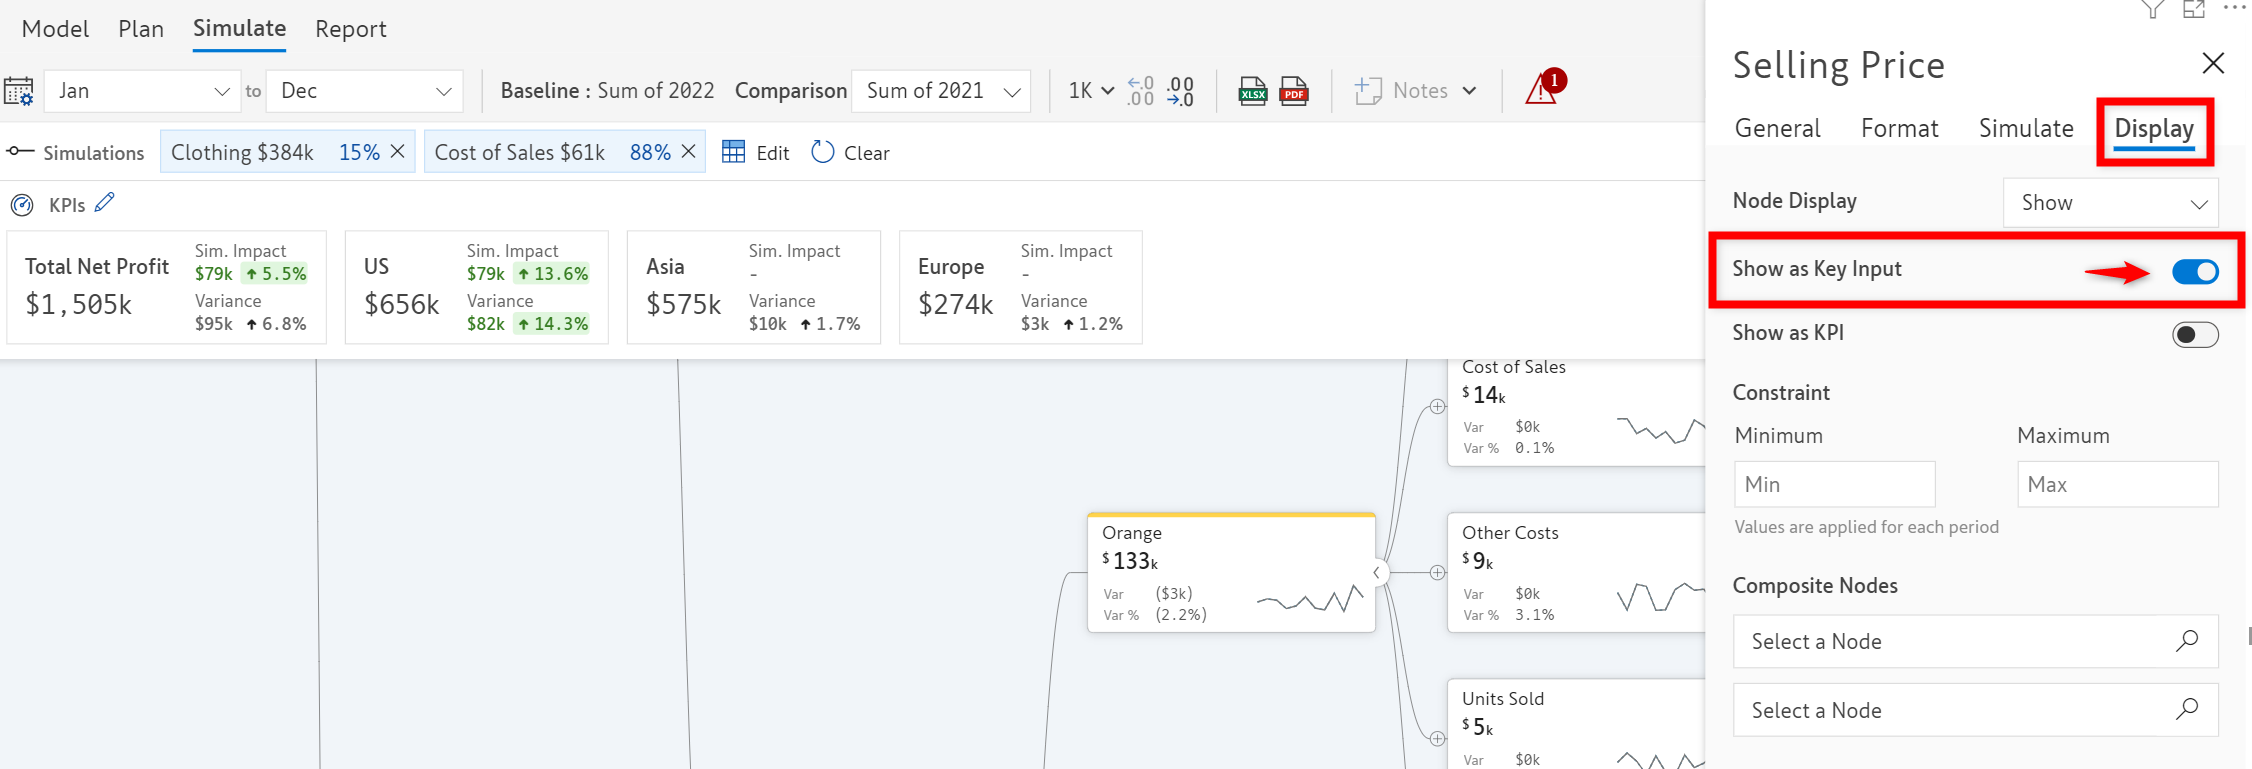
Another way to add key inputs is through the Node Settings window. To open that window, click on the three dots menu and choose Edit Node.
This opens the Node Settings window, where you can go to the Display section and enable the toggle button Show as Key Input.
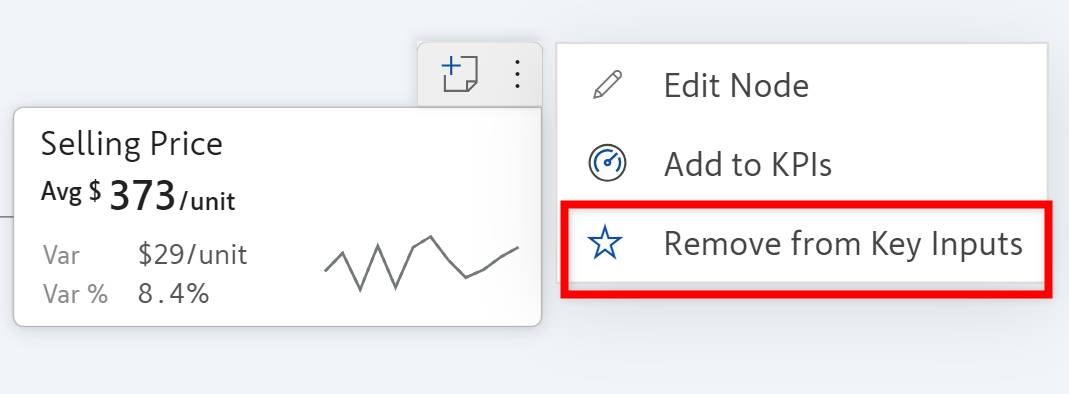
To remove a key input, choose Remove from Key Inputs from that specific node's menu.
In table view, click on the three dots in the actions column beside the required key input and choose Remove from Key Inputs.
The third way to remove a node from Key Inputs is to disable the toggle button Show as Key Input in the Display section of the Node Settings window as explained here.
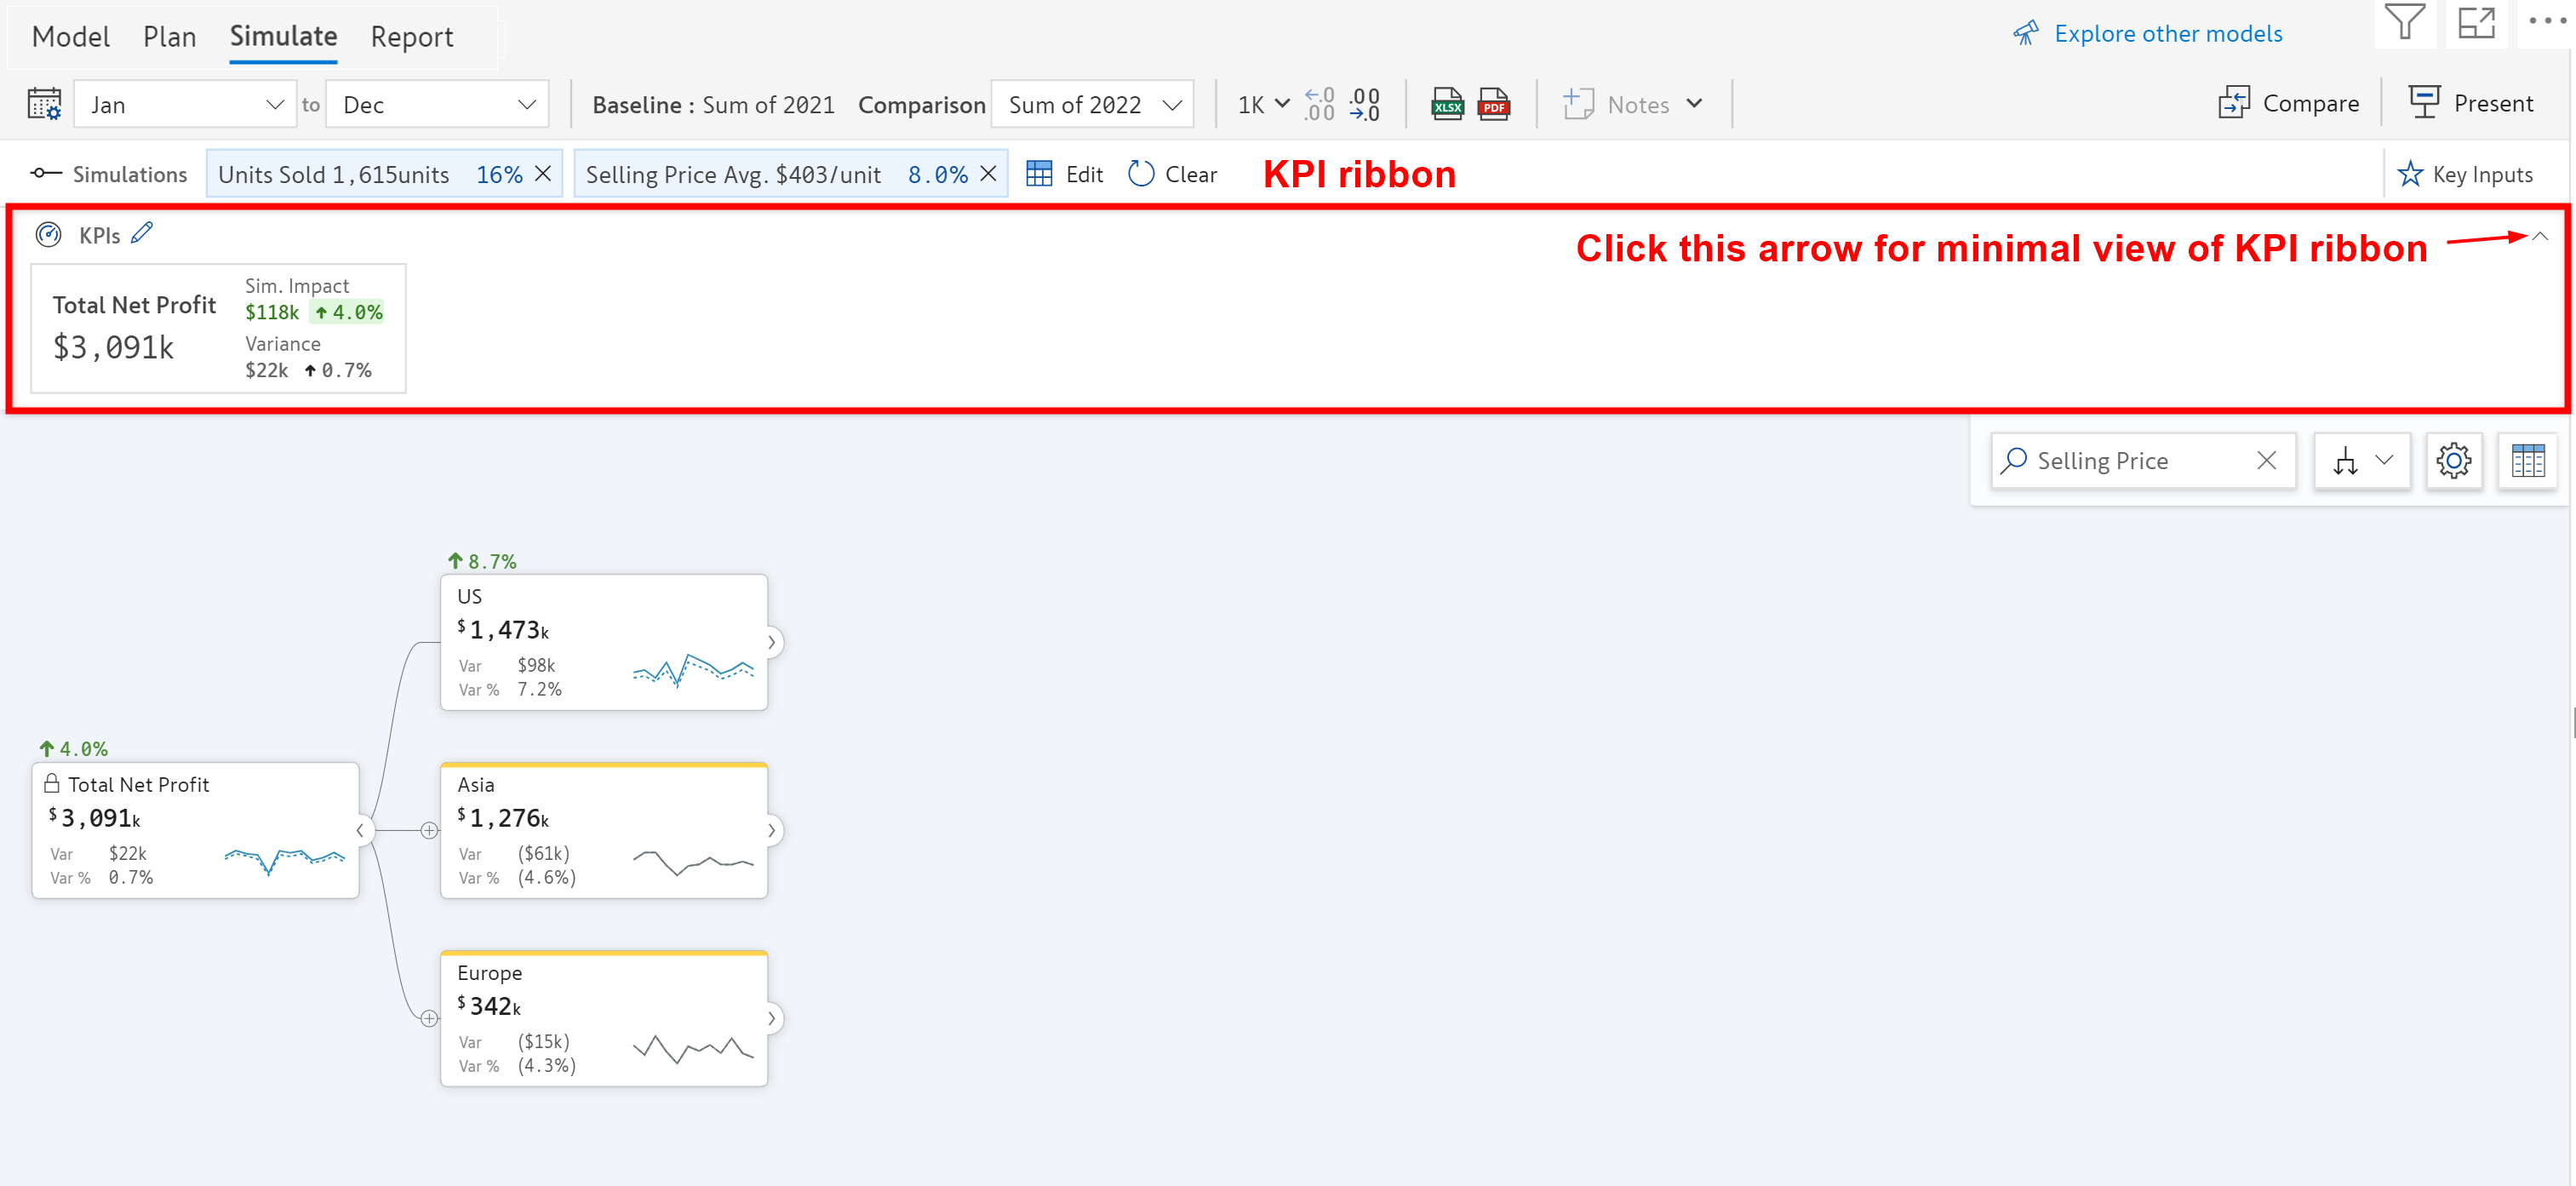
Any important node that you consider as a Key Performance Indicator can be added as a KPI. All the added KPIs are displayed on the KPI ribbon so that after a simulation is done you can see them being dynamically updated with their new value, variance percentage and the simulation impact.
Find below the minimal view of KPI ribbon.
Click on the menu at the top right corner of the node. Then choose Add to KPIs. The node is now a KPI.
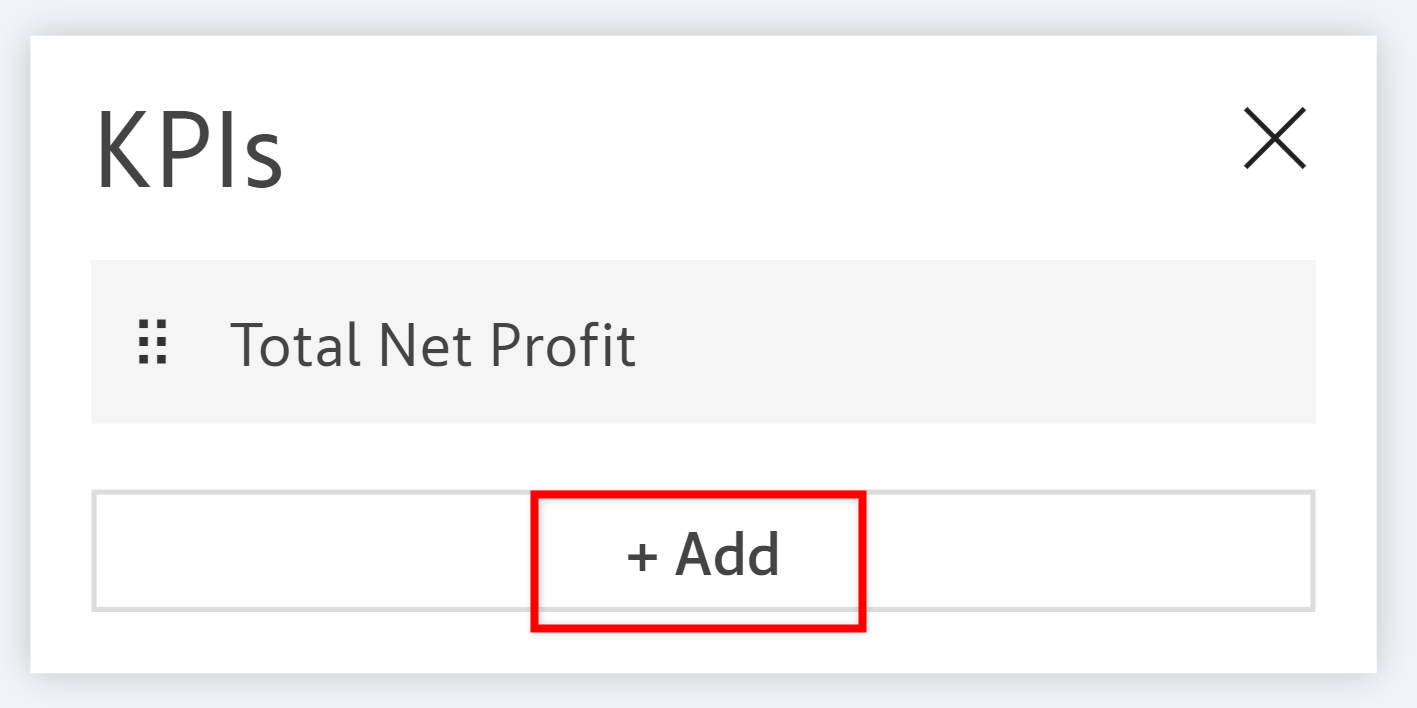
Alternatively, click the pencil icon beside KPIs on the KPI ribbon.
Click Add from the pop-up.
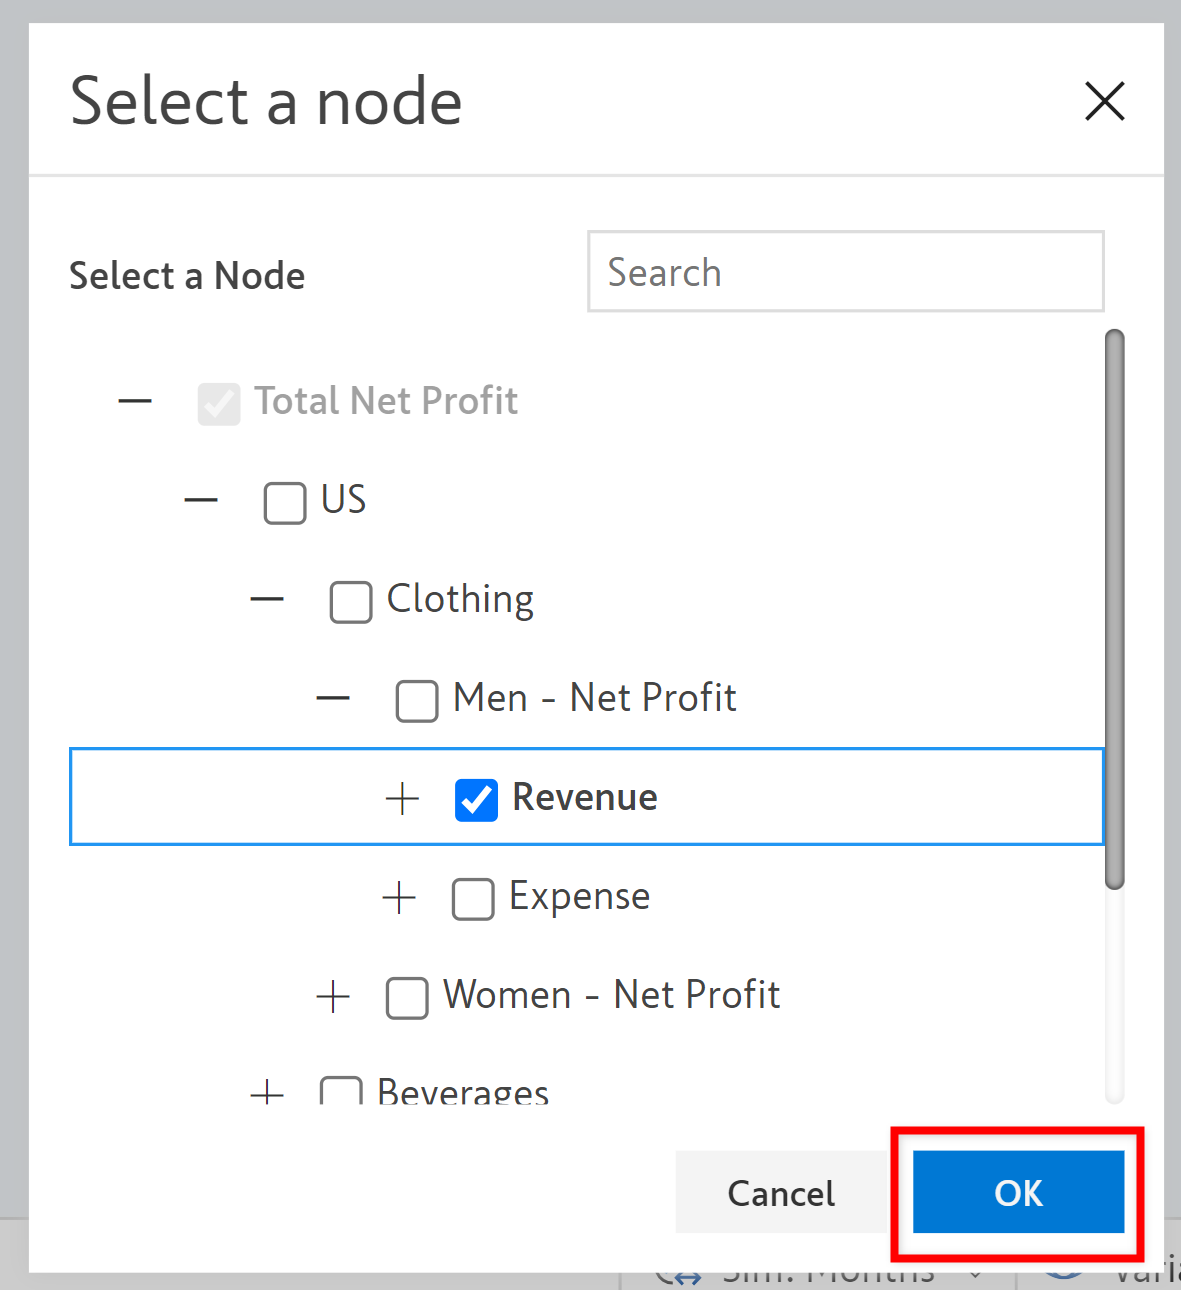
Choose the desired node from the list to be added as a KPI.
Another way to add KPIs is through the Node Settings window. To open that window, click on the three dots menu and choose Edit Node.
This opens the Node Settings window, where you can go to the Display section and enable the toggle button Show as KPI.
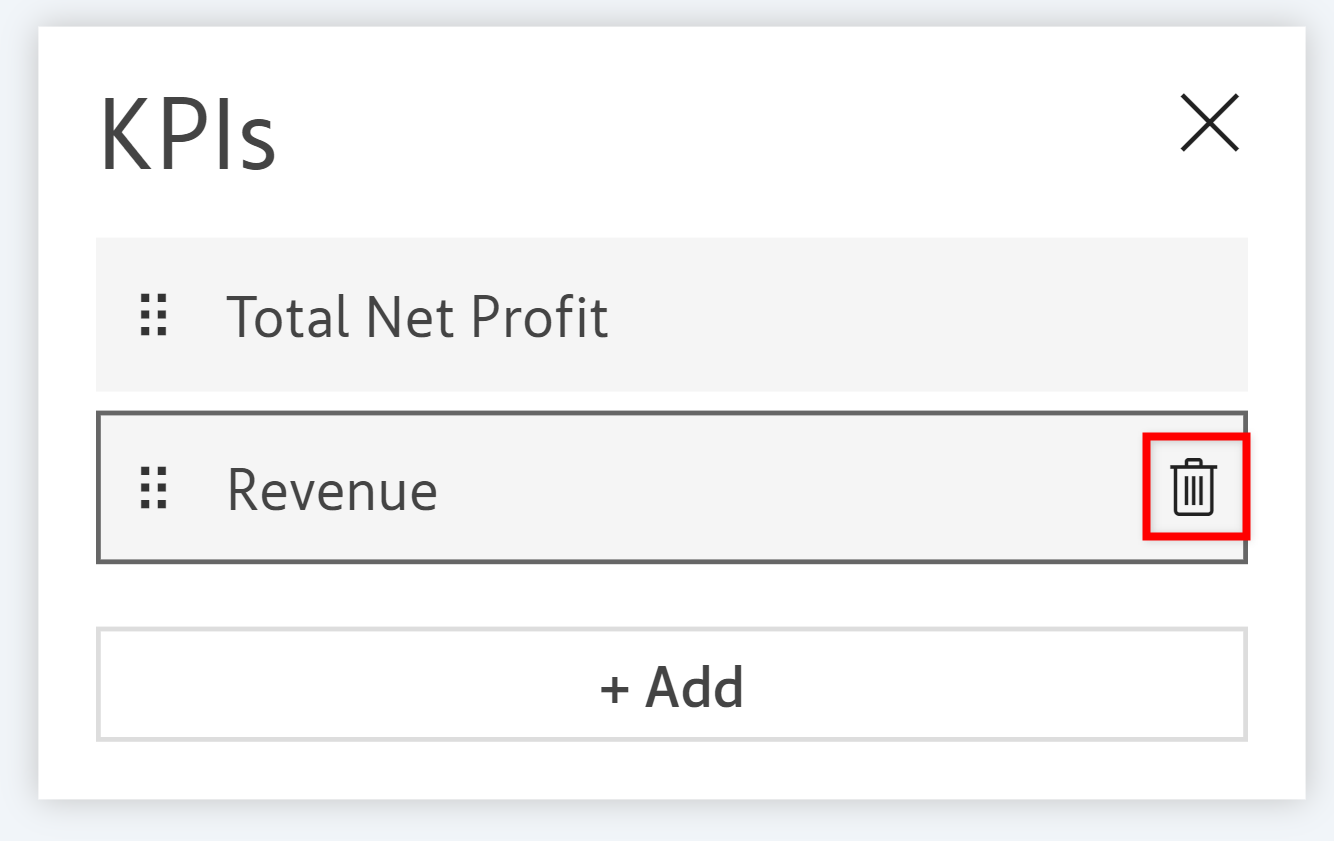
To remove a node from the KPIs list, click on the pencil icon beside KPIs on the KPI ribbon. Then select the bin icon beside the desired node to remove it.
You can also click on the three-dots menu on the required node and choose Remove from KPIs.
The third way to remove a node from KPIs is to disable the toggle button Show as KPI in the Display section of the Node Settings window as explained here.
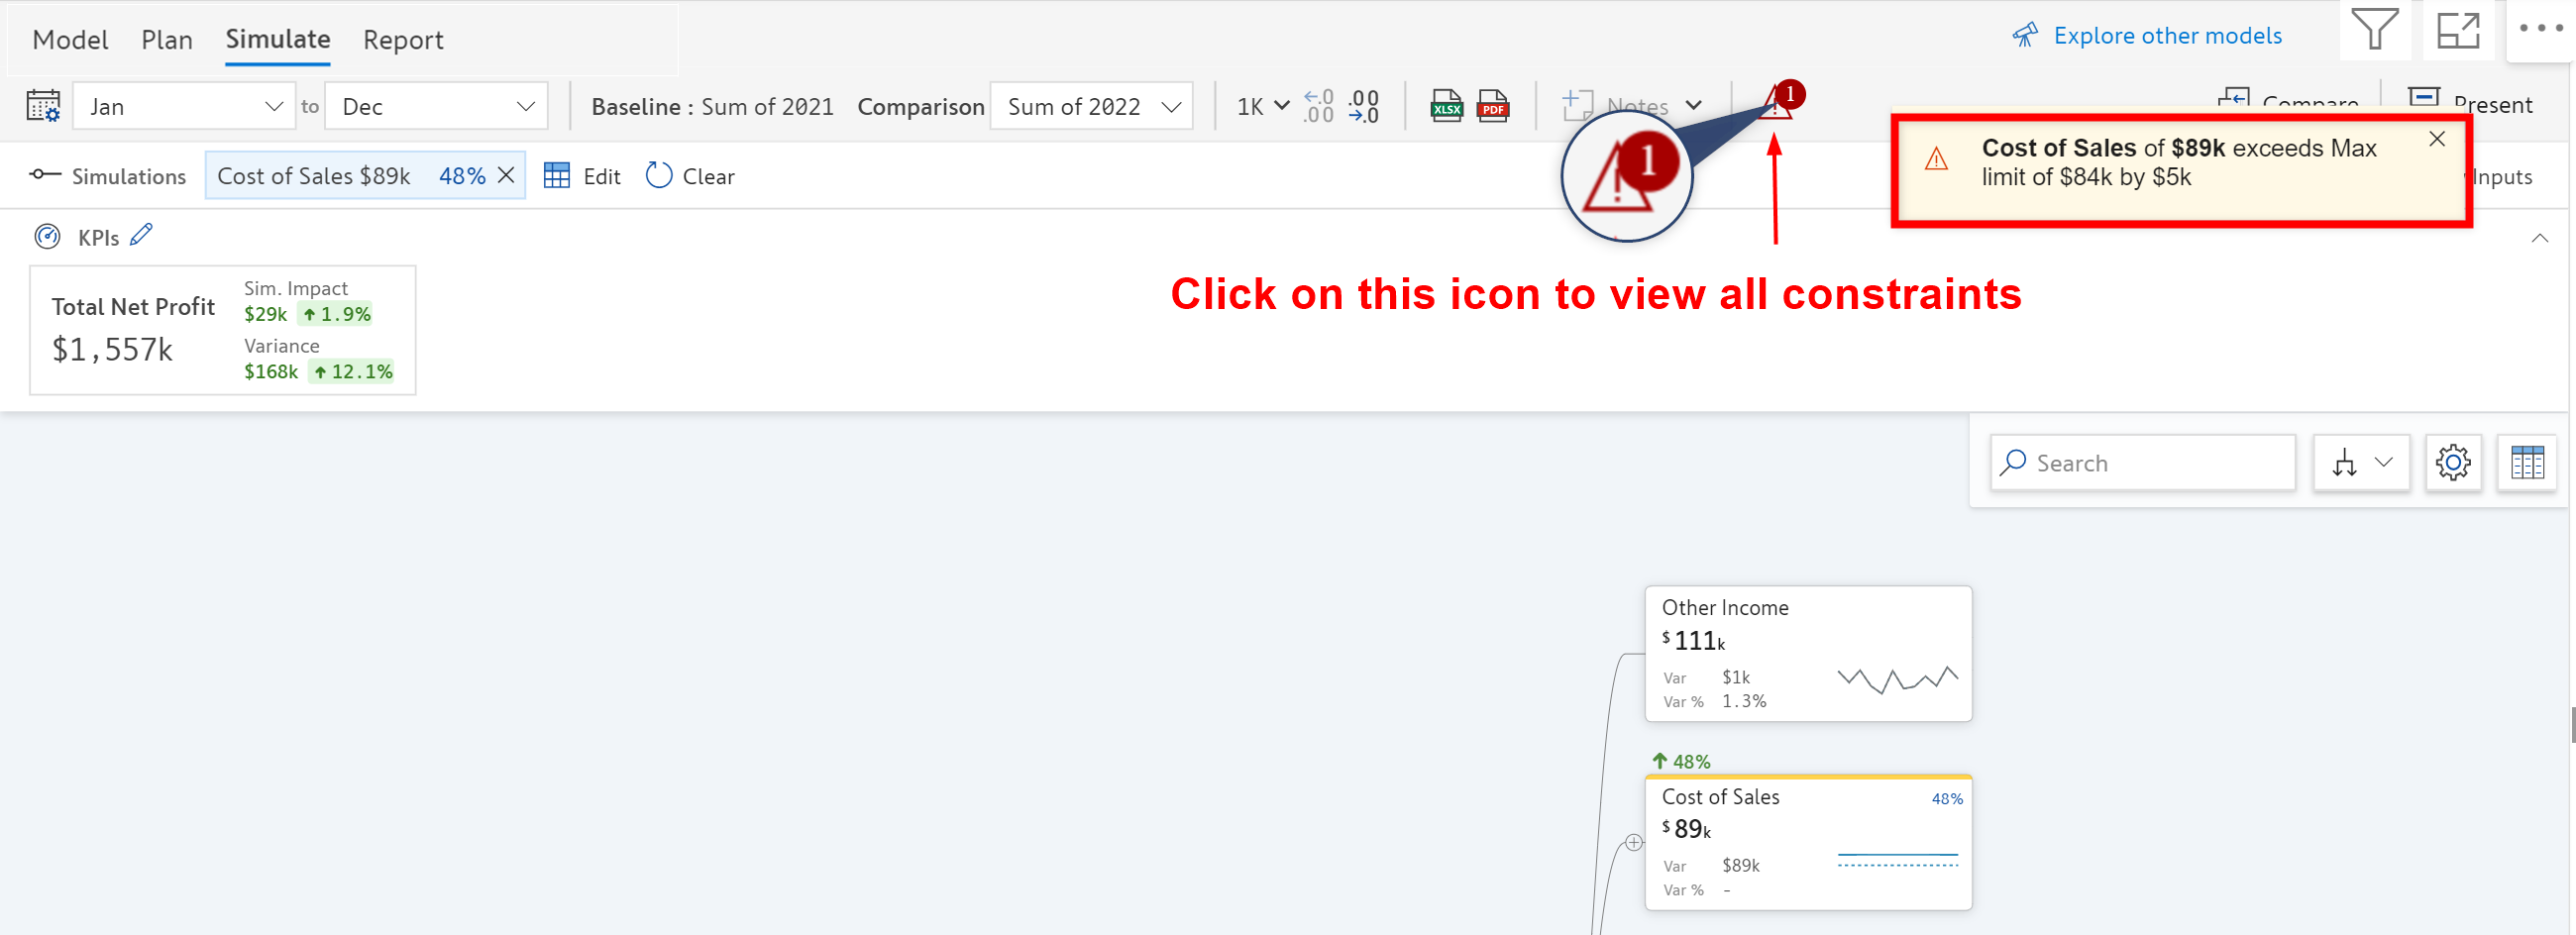
Constraint is added to a node to evaluate its performance after simulation, against a threshold. After the simulation, if the node values fall below or exceed these threshold limits, a warning pops up on the screen saying that the constraint has been violated along with the difference by which it has exceeded or fallen below.
Clicking on the violation warning symbol displays all the constraints set by the user in the model.
Constraints can be added to the nodes through the Node Settings window. To know more, click here.
Simulation period helps set active periods to which you can perform simulation. By default, all the periods are set as the simulation period, and they can be changed to any range of periods (including a single period) for the scenarios. This behavior ensures that when you perform a simulation to the total value it only applies the simulation to the simulation period range.
To select the simulation period range, use the drop-down list at the top.
In the below example, simulation periods have been selected as 'Apr' through 'Dec', hence the simulation is applied only to these periods as shown below.
As you can see from the table view below, the periods outside the range of the simulation period are greyed out/locked indicating that the simulation has not been performed on these periods and they are the actuals.
All the scenarios created in the model would share the same simulation period.
You can select which node details to display in the tree or table view using the Manage View option.
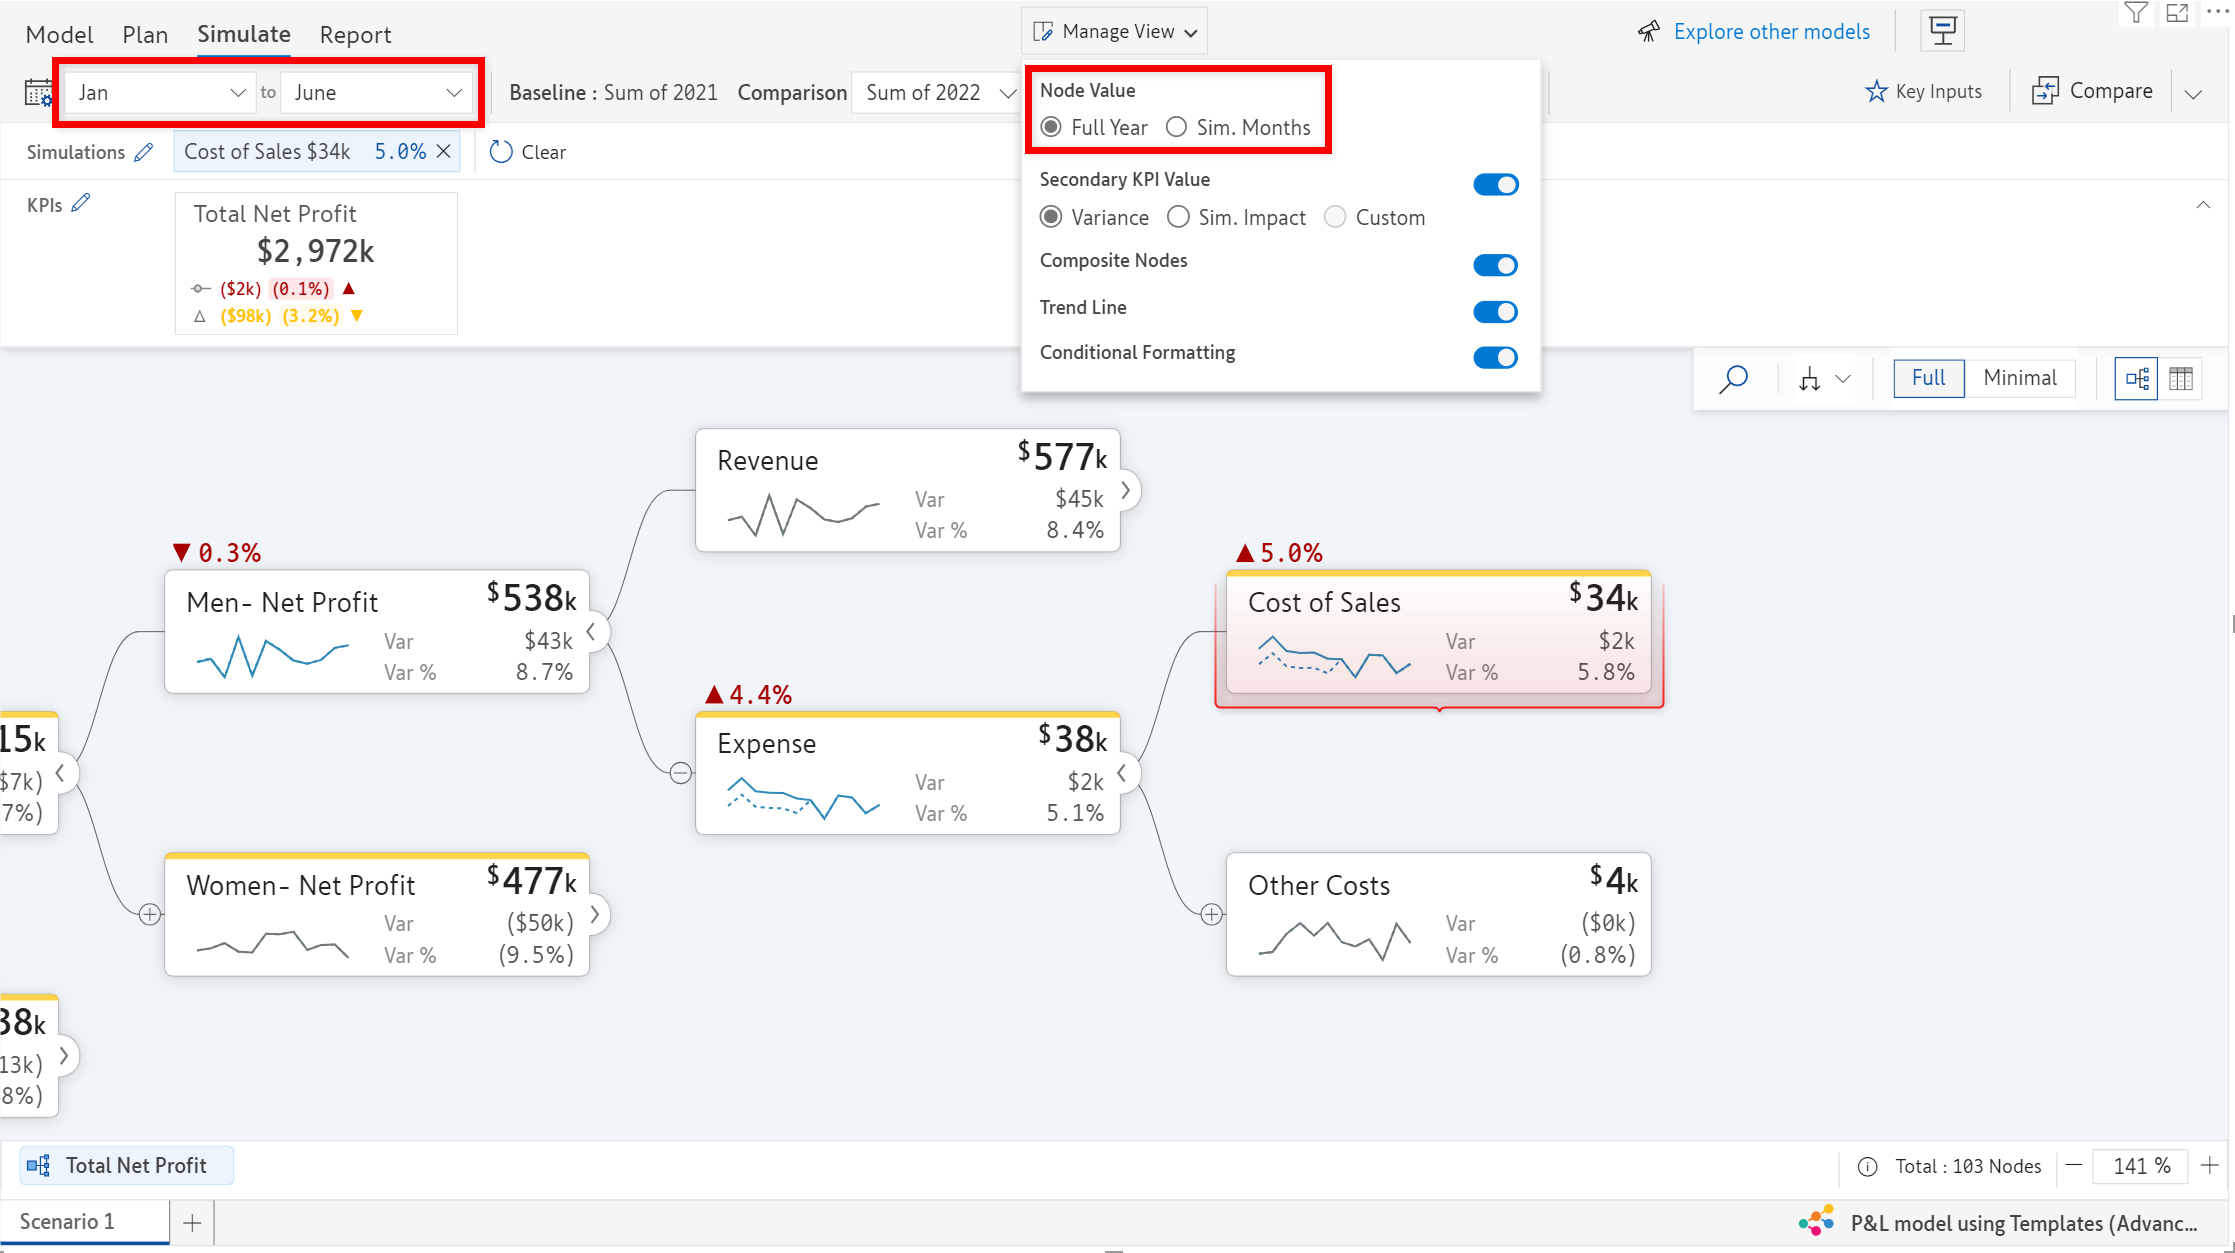
With this option, you can view the node value, variances, and simulation impact for either only the simulation periods or for all the periods.
In the below example, the model has the time period in months and the simulation period is chosen as Jan to June. A simulation of 10% change is applied to the Cost of Sales node. On choosing the Sim.Months option, the simulation impact is displayed as 10% and the simulated variances are shown for these 6 periods only.
On Choosing the Full Year option, the simulation impact and the variances are re-calculated for all 12 months (Full Year range here, consists of Jan to June as simulation periods and Jul to Dec as actuals). Hence, the simulation impact is shown as 5% for the full year.
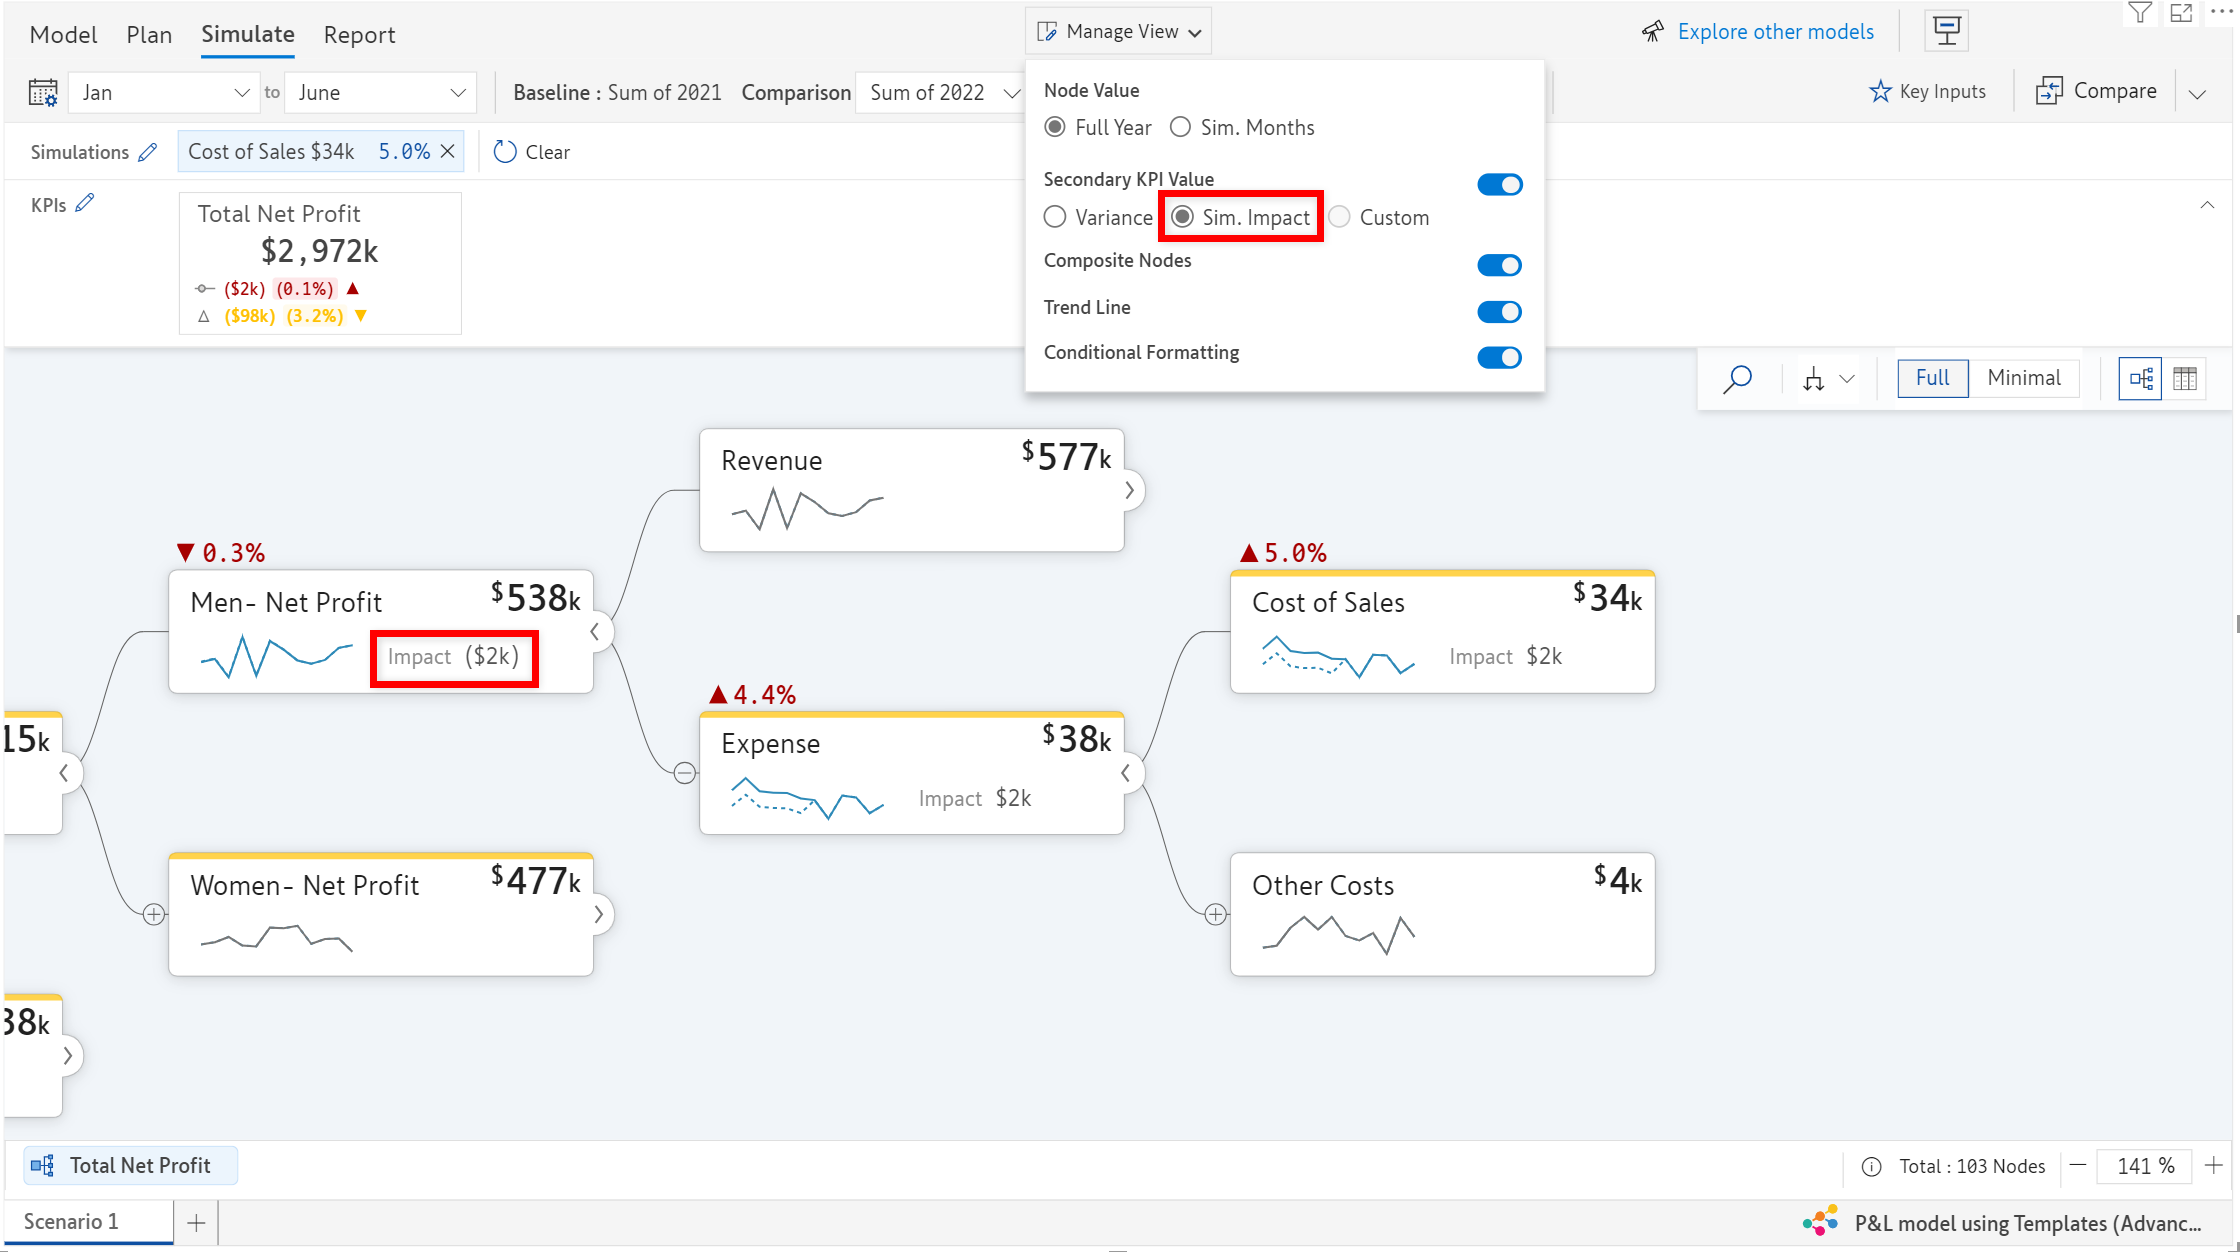
To view the secondary KPIs on nodes, click on the option available here as shown in the image.
To learn how to set secondary KPIs, check out this section.
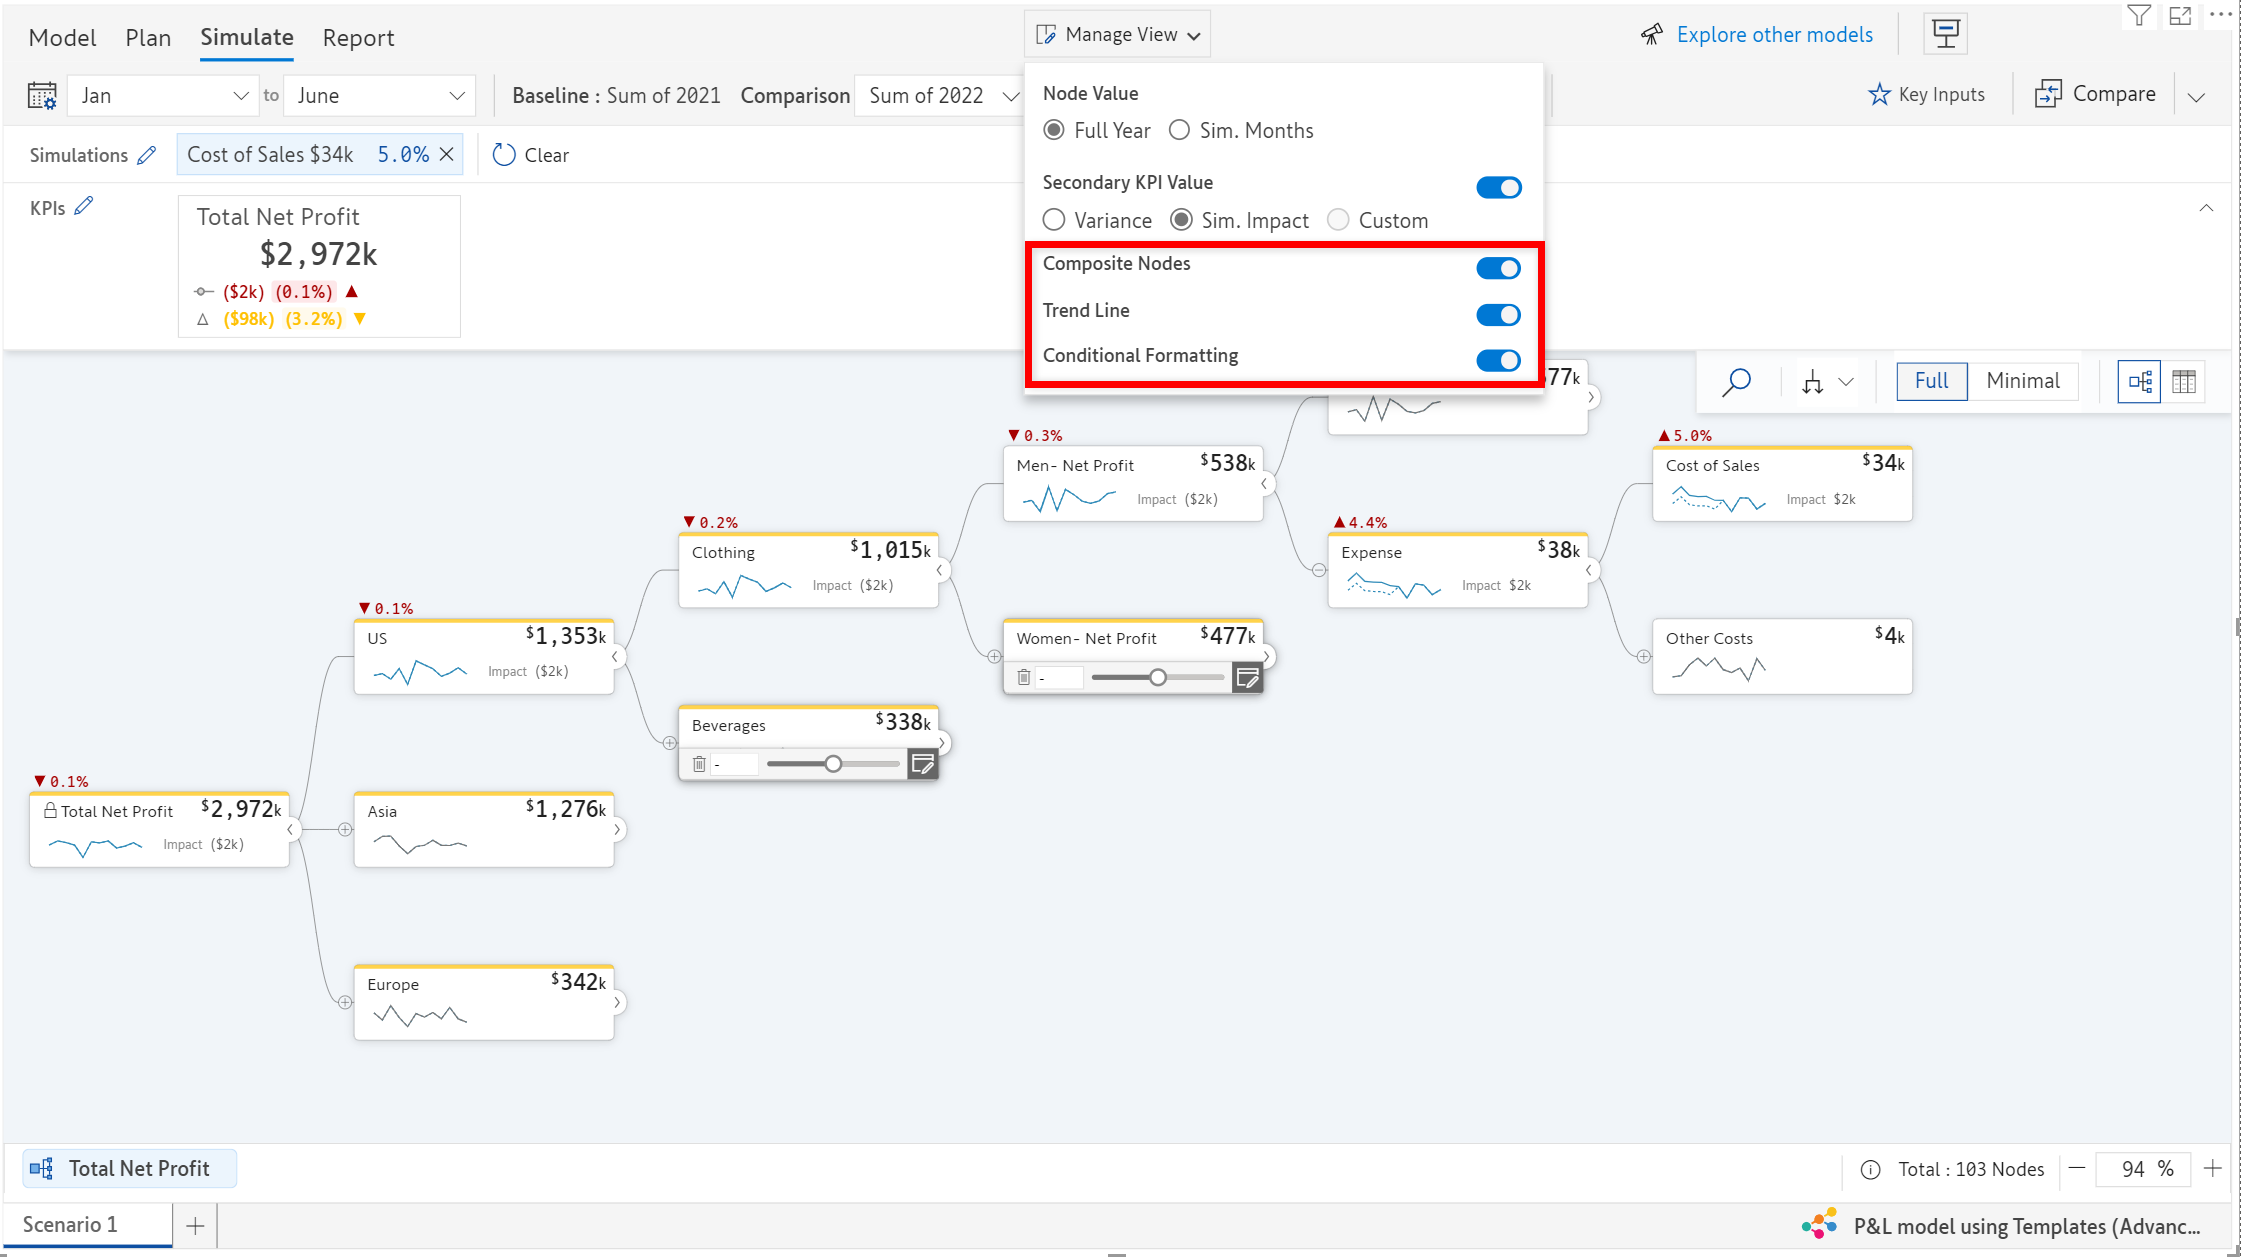
You can display or hide a few more details like variance, variance%, simulation impact%, trendlines, conditional formatting, composite nodes, etc. by toggling the respective buttons.
In Table View, you can check on the fields that you wish to display.
To lock a specific node from being simulated, you can set the Simulation Method of that node to None. To know more, click here.
In the below image, the node that is disabled for simulation has a lock symbol to indicate the same.
This creates a new tab with only the selected node and its children showcased on the canvas.
You can create multiple focus nodes and click on the required tabs/focus nodes to switch between the views and quickly navigate through the model.
Within the settings menu, you can find custom display options like show or hide empty nodes, node count, conditional formatting, and impacted nodes by simulation. You can change canvas and display-related settings like expansion level, theme, main color, font color, background color, the color of derived nodes, connectors, etc. from here.
Accessing this menu from the table view provides table design-related settings as shown below.
Change the number scaling on nodes and increase or decrease decimals by clicking on this option at the top.
To export your scenario to Excel or in PDF, click on the icons as shown in the below image. This is already discussed in Export Scenario.
When you are working on large models, you might need to focus and zoom in on a specific node and its children on the canvas at the click of a button. Focus Node feature comes in handy in this case. Hover over the node and then click on icon on the top right corner of the node.